

Reading market charts is one of the most important skills for anyone interested in trading or investing. A chart is not just a collection of colorful candles and moving lines; it is a visual story showing how buyers and sellers behave over time. Every price movement represents decisions, emotions, expectations, and reactions from thousands or even millions of market participants. Learning how to understand this information can help traders make more informed decisions instead of relying only on guesswork.
TradingView has become one of the most widely used platforms for analyzing financial markets because it combines professional charting tools with a beginner-friendly interface. The platform provides multiple chart styles, technical indicators, drawing tools, alerts, screeners, and community-created analysis features. TradingView currently supports various chart types, including candlestick, line, bar, Heikin Ashi, Renko, and other specialized formats designed for different analysis methods.
However, having access to advanced tools does not automatically make someone a successful trader. Think of TradingView like a powerful camera. A professional photographer can create amazing images because they understand how to use the settings, while a beginner may still struggle despite having the same equipment. Similarly, traders need to understand chart structure, price behavior, and market psychology before using advanced features.
This practical guide will help you understand how to read market charts using TradingView step by step. Whether you are analyzing stocks, cryptocurrencies, forex, commodities, or indices, the basic principles remain similar.
Table of Contents
ToggleUnderstanding Why Market Charts Matter for Traders
A market chart is a visual representation of price movement over a specific period. Instead of reading thousands of numbers, traders use charts to quickly identify patterns, trends, and possible opportunities. A chart transforms raw market data into a picture that the human brain can analyze more easily.
Imagine watching a football match without seeing the scoreboard. You might hear the crowd, but understanding the actual progress would be difficult. A market chart works like a scoreboard because it shows whether buyers or sellers are controlling the game. When prices rise consistently, buyers are showing strength. When prices fall, sellers may have greater control.
Charts are commonly used in technical analysis, a method that focuses on historical price movements and trading activity. Technical analysts believe that price patterns often repeat because human emotions such as fear, greed, excitement, and uncertainty influence market decisions.
TradingView makes this process easier by allowing traders to customize charts according to their strategies. Users can add indicators, compare assets, create watchlists, and save layouts. The platform also provides access to thousands of technical indicators and community scripts created through Pine Script.
The Role of Price Action in Market Analysis
Price action refers to studying the movement of price itself without depending heavily on indicators. Many experienced traders believe that price contains important information about market conditions.
For example, if a stock repeatedly fails to move above a certain level, traders may consider that area a resistance zone. If buyers repeatedly enter near a particular price, that area may become support.
Price action analysis focuses on questions like:
- Is the market making higher highs and higher lows?
- Is momentum increasing or decreasing?
- Are buyers or sellers becoming stronger?
- Is the price approaching an important level?
Understanding price action helps traders avoid blindly following indicators. Indicators are useful tools, but they are based on price data. Learning to read price first creates a stronger foundation.
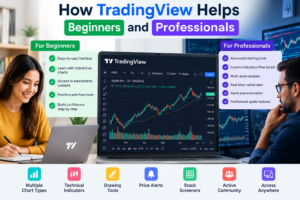
How TradingView Helps Beginners and Professionals make image
TradingView is designed for different levels of market participants. Beginners can start with simple charts, while experienced traders can create complex strategies using advanced tools.
One major advantage of TradingView is flexibility. Traders can change timeframes, add indicators, draw trend lines, set alerts, and analyze multiple markets from one platform. According to TradingView’s official features, the platform offers multiple chart layouts, hundreds of built-in indicators and strategies, drawing tools, screeners, and alert systems.
For beginners, the biggest benefit is learning visually. Instead of memorizing theoretical concepts, traders can immediately see how patterns form in real markets.
For example:
- A beginner learning support and resistance can draw horizontal lines directly on a chart.
- Someone studying moving averages can observe how price reacts around those averages.
- A trader learning candlestick patterns can review historical examples using replay features.
The key is to avoid adding too many tools too quickly. A clean chart often provides better understanding than a screen filled with dozens of indicators.
Getting Familiar with the TradingView Chart Interface
When you first open a TradingView chart, the amount of information can feel overwhelming. There are menus, buttons, indicators, price scales, time scales, and drawing tools everywhere. However, once you understand the basic sections, navigation becomes much easier.
The main chart area displays price movement. The horizontal axis represents time, while the vertical axis represents price. Every candle or bar represents what happened during a selected period.
The top toolbar usually contains options for changing symbols, timeframes, chart types, indicators, and layouts. The left toolbar includes drawing tools such as trend lines, support/resistance lines, and measurement tools. The right side commonly includes watchlists, alerts, and market information.
A good beginner approach is to spend time exploring the interface before analyzing real trades. Learning where tools are located saves time and reduces mistakes later.
Understanding the Main Chart Window
The chart window is where most analysis happens. It shows price movement and allows traders to study market behavior.
Important areas include:
Price Scale: Shows current and historical prices.
Time Scale: Shows when price movements occurred.
Volume Panel: Displays trading activity.
Indicator Area: Shows additional analysis tools.
A trader should first focus on price movement before adding extra information. Ask simple questions:
- Is price moving upward, downward, or sideways?
- Are candles becoming larger or smaller?
- Is trading volume increasing?
- Are important levels nearby?
These basic observations form the foundation of chart reading.
Learning Timeframes and Chart Navigation
Timeframe selection is one of the most important decisions when reading charts. A timeframe determines how much market activity each candle represents.
Examples:
- 1-minute chart: Each candle shows one minute of movement.
- 1-hour chart: Each candle shows one hour.
- Daily chart: Each candle represents one trading day.
- Weekly chart: Each candle represents one week.
Short-term traders often use smaller timeframes, while long-term investors usually focus on daily or weekly charts.
A common mistake among beginners is focusing only on one timeframe. A better approach is using multiple timeframe analysis. For example, a trader may use a daily chart to understand the overall trend and a smaller timeframe to identify possible entry points.
How to Read Candlestick Patterns on TradingView
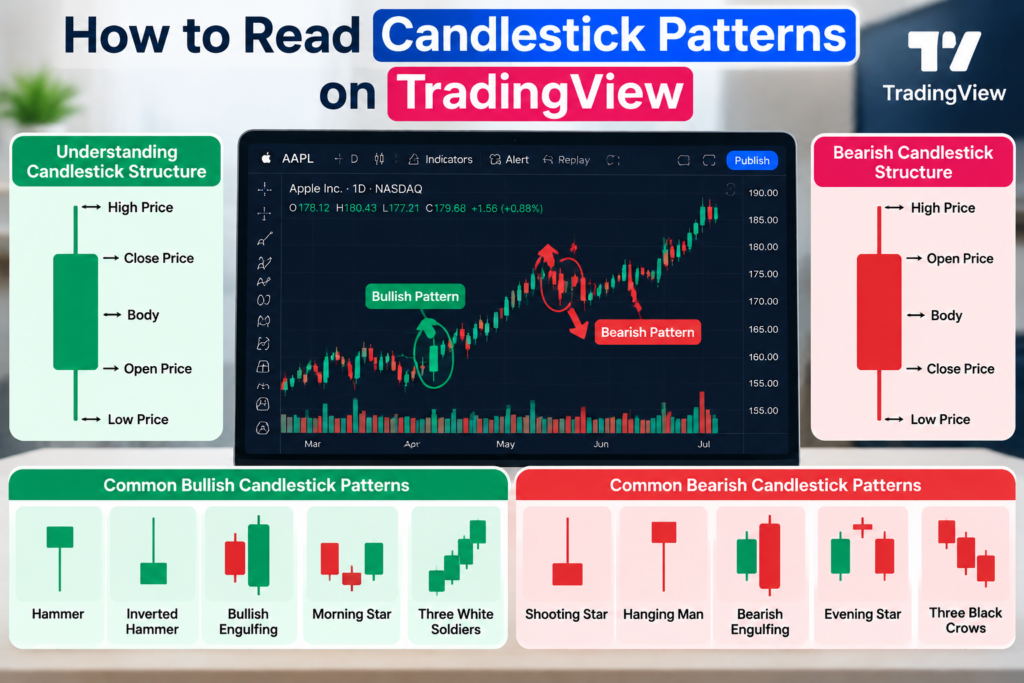
Candlestick patterns are one of the most popular methods for understanding market psychology.
A single candle can tell a story. For example, a candle with a long lower wick may suggest that sellers pushed prices down but buyers returned strongly.
Common patterns traders study include:
- Doji candles showing market uncertainty.
- Hammer patterns showing possible buying pressure.
- Engulfing patterns showing strong momentum changes.
However, traders should avoid treating patterns as guaranteed signals. A candle pattern becomes more meaningful when combined with market context, trend direction, and important price levels.
Choosing the Right TradingView Chart Type
TradingView offers many chart styles because different traders analyze markets differently. The right chart type depends on your strategy and goals.
Candlestick Charts Explained
Candlestick charts are the most popular chart type among traders because they provide detailed information in a simple visual format.
Each candle shows four important prices:
- Open price
- High price
- Low price
- Close price
A candle with a strong upward movement usually shows buying pressure, while a downward candle indicates selling pressure.
Candles contain:
- Body: Difference between opening and closing price.
- Wick or shadow: Shows the highest and lowest prices reached.
Large candle bodies often indicate strong momentum, while small bodies may indicate uncertainty.
Line, Bar, and Advanced Chart Types
Line charts connect closing prices and provide a simple view of market direction. They are useful for beginners who only want to understand general trends.
Bar charts provide more information than line charts by showing opening, high, low, and closing prices.
Advanced charts like Heikin Ashi, Renko, and Volume Footprint are designed for specialized analysis. TradingView provides more than 20 chart types, allowing traders to choose different ways to visualize price behavior.
Using Technical Indicators Effectively on TradingView
Indicators can help traders analyze market conditions, but they should support decision-making rather than replace understanding.
Popular indicators include:
- Moving Average: Helps identify trends.
- Relative Strength Index (RSI): Measures momentum.
- MACD: Shows momentum changes.
TradingView provides hundreds of built-in indicators and allows users to create custom scripts.
A common beginner mistake is adding too many indicators. When five indicators are displayed, many traders become confused because each tool may provide different signals.
A better method is selecting a few tools that match your strategy.
Identifying Trends, Support, and Resistance Levels
Trend identification is one of the simplest but most powerful chart-reading skills.
Three basic market conditions exist:
Uptrend: Price creates higher highs and higher lows.
Downtrend: Price creates lower highs and lower lows.
Sideways Market: Price moves within a range.
Support and resistance levels help traders understand areas where price may react.
Support acts like a floor where buyers often appear.
Resistance acts like a ceiling where sellers may become active.
TradingView drawing tools make it easy to mark these levels directly on charts.
Using TradingView Drawing Tools for Better Analysis
Drawing tools help traders organize their thoughts visually.
Useful tools include:
- Trend lines
- Horizontal lines
- Fibonacci retracement
- Channels
- Shapes and notes
A trend line connecting higher lows can help visualize an upward movement. Fibonacci tools are often used by traders studying possible retracement areas.
The goal is not to decorate charts but to create a clear analytical framework.
Understanding Volume and Market Strength
Price tells you what happened, while volume provides clues about participation.
High volume during a price movement often indicates stronger market interest. Low volume may suggest weaker participation.
For example, if a stock breaks above resistance with strong volume, traders may consider the move more significant than a breakout with very little activity.
Volume analysis should always be combined with price behavior rather than used alone.
Creating a Simple TradingView Chart Analysis Routine
A consistent routine helps traders avoid emotional decisions.
A basic process could include:
- Identify the overall trend.
- Mark important support and resistance levels.
- Check volume activity.
- Review indicators if needed.
- Create a trading plan before taking action.
Successful chart reading is less about predicting the future and more about preparing for different possibilities.
Common Mistakes Beginners Make While Reading Charts
Many beginners make mistakes because they expect charts to provide perfect answers.
Common problems include:
- Using too many indicators.
- Ignoring risk management.
- Trading based on emotions.
- Looking only at short timeframes.
- Entering trades without a plan.
Charts provide information, but they do not remove uncertainty. Markets are influenced by economic events, company news, global conditions, and investor sentiment.
A disciplined approach is more important than finding a magical indicator.
Conclusion
Learning how to read market charts with TradingView is a valuable skill for anyone interested in financial markets. A chart is more than a collection of candles; it is a visual representation of market psychology, supply, demand, and human behavior.
TradingView provides powerful tools that make technical analysis accessible to beginners and professionals. From candlestick charts and indicators to drawing tools and alerts, the platform offers everything needed to study market movements effectively.
The most important step is building a strong foundation. Start with understanding price action, trends, support, resistance, and volume before exploring advanced strategies. With regular practice and disciplined learning, reading charts can become a structured skill rather than a confusing activity.
Remember, charts do not predict the future with certainty. They help you understand possibilities and make better-informed decisions.
Read Also:
Choosing the Right Construction Tools and Equipment with HSS Hire
Best Print-on-Demand Features to Consider When Comparing Printful (POD competitor)
What Travelers Should Know Before Booking a Holiday with Lopesan (US)
The Ultimate Guide to Saving Money on Car Rentals with DiscoverCars
A Complete Guide to Web Hosting and Domains with Hostalia ES
Frequently asked questions
Yes, TradingView is suitable for beginners because it provides simple charts along with educational tools, indicators, and drawing features. New users can start with basic candlestick charts and gradually explore advanced functions.
Candlestick charts are generally the most popular choice for beginners because they show detailed price information, including opening, closing, high, and low prices.
There is no fixed number, but beginners usually benefit from keeping charts simple. Using a few well-understood indicators is often better than adding many confusing tools.
No platform can predict future prices with certainty. TradingView helps analyze market information and identify possible patterns, but market movements always involve risk.
Many traders and investors use TradingView because of its charting tools, market data features, alerts, and customization options. However, professional approaches vary depending on individual strategies.